
In a previous post I discussed some initial investigations into the use of unsupervised learning techniques (i.e. clustering) to identify usage patterns in web search logs. As you may recall, we had some initial success in finding interesting patterns of user behaviour in the AOL log, but when we tried to extend this and replicate a previous study of the Excite log, things started to go somewhat awry. In this post, we investigate these issues, present the results of a revised procedure, and reflect on what they tell us about searcher behaviour.
So to recap, last time we got to the point where we’d applied the expectation maximization algorithm to a sample of 10,000 sessions from the AOL log, and were hoping to replicate the findings from Dietmar Wolfram’s 2008 study. But our results were very different: three clusters instead of four, and some very different patterns. Moreover, our results weren’t even replicable within themselves: a further three samples of 10,000 sessions produced widely different outcomes (7, 10 and 10 clusters respectively). Even increasing the sample size to 100,000 seemed to make little difference (despite the suggestion in Wolfram’s paper that subsets of 50k to 64k sessions should produce stable clusters).
So why are we seeing such different results? One interpretation may be of course that these insights are indeed an authentic reflection of changes in user behaviour due to differences in context (e.g. a different search engine, time period, demographic, etc.) But before we explore that possibility, we should take steps to discount the effect of other confounding factors. For example, is our data truly representative of the population? Taking a further sample of sessions is a relatively straightforward test of this, and indeed, applying EM to a fresh sample of 10,000 sessions produced the following 4 clusters [note that I have changed the display order of the features to facilitate comparison with Wolfram’s results, and simplified their names]:

- Expectation Maximization using Wolfram’s 6 features on 10,000 sessions from AOL

This outcome seems to offer some interesting insights, but again, it fails to repeat across the other samples; with 5, 6 and 7 clusters produced each time. Moreover, increasing the sample size to 100,000 also fails to produce a stable result, with 7, 13, 6 and 6 clusters produced on each iteration.
But let’s pause for a moment and examine the pattern in more detail. There is something very odd happening with term popularity now: we see a small cluster (just 3% of the sessions) where this feature seems to be something of an outlier, compressing the remaining traces into a narrow band. Indeed, the phenomenon becomes even more pronounced when we take a sample of 100,000 sessions:

- Expectation Maximization applied to 100,000 sessions

Perhaps this is an artefact of the clustering algorithm? Let’s try XMeans instead (which is a variant of kMeans where the value for k is determined by the algorithm). In this iteration, XMeans finds a local optimum at k=10, so the number of clusters is different. But the overall pattern, with a small cluster (1% of sessions) representing outlier values for term popularity is again clearly visible:

- XMeans (k<=10) applied to 100,000 sessions

So something else must be at play. It turns out that there is indeed an artefact in the data which is causing this. Long story short, there are a small number of sessions which contain just a single query, consisting solely of the character ‘-‘. Precisely why they are there is a matter for speculation: they may have been the default query in some popular search application, or an artefact of some automated service or API, etc. We’ll probably never know. But sessions like these, along with other robot-generated sessions, aren’t generally helpful when trying to understand human behavioural patterns. Instead, they are best removed prior to analysis. Of course, there are no 100% reliable criteria for differentiating robot traffic from human, and what should be removed is a matter for judgement, often on a case-by-case basis. In this case, including these single character queries appears to be counter-productive.
So now, with a new sample of 100,000 sessions excluding these outlier queries, we see EM produce the following output:
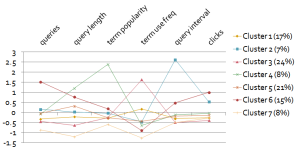
- Expectation Maximization applied to a new sample of 100,000 sessions
This pattern is much more stable, with four iterations producing 7, 7, 7 and 9 clusters respectively. At this point we can start to speculate on what these patterns may be telling us. For example:
- Cluster 6 appears to be a group of users that engage in longer sessions, with many queries and many page views (clicks), but few repeating terms
- Cluster 4 appears to be a smaller group who seem to specialise in relatively long but popular queries (an odd combination!), also with few repeating terms
- Cluster 3 appears to be a relatively large group who make greater use of repeated terms, but are otherwise relatively unengaged (with shorter sessions and fewer page views)
And so on. Evidently, the patterns above are somewhat hard to interpret due to the larger number of clusters and lines on the chart. So what would happen if we tried to determine the optimum number ourselves, rather than letting XMeans find one for us? One way of investigating this is to specify different values for k a priori, and see how the within-cluster sum of squared errors (which is calculated by Weka as part of its output) varies on each iteration. For example, varying k from 2 to 10 gives us the following result:

- Sum of squared errors by k

As we can see, there is an ‘elbow’ around k=4 and another around k=7. This implies that either of these two values may be good choices for a local optimum. We’ve already seen the output for k=7 (which is the optimum that xMeans found), so now let’s try kMeans with k=4:

- kMeans (k=4) applied to 100,000 sessions

This time the groups are somewhat easier to differentiate. For example, we might infer that:
- Cluster 3 represents a baseline or ‘generic’ cluster of users who hover around the average for all measures
- Cluster 4 represents a relatively large group of users who engage in longer sessions (with more queries and page views) but are diverse in their interests, with few repeated terms
- Cluster 1 represents a smaller group who are the converse to cluster 4, engaging in shorter sessions but with more repeated terms
- Cluster 2 represents a tiny group (2%) of users who are similar to cluster 1 but focus on highly popular queries
Evidently, there are other ways we could analyse this data, and there are other ways we could interpret the output. In fact, I hope to write more about search log analysis in the coming weeks, taking advantage of a new source of data, which should further validate the methodology and allow us to explore some very different behaviour patterns. But for now, let’s draw some of the threads together and review what we’ve learnt.
Conclusions
- Replicate to validate: As researchers, our instincts are to explore the unknown, to solve the unsolvable, and to favour novelty over repetition. But sometimes it befits us to focus on replication: by applying new techniques to old data, we validate our methodology and build a more reliable baseline for our own experimental work.
- Features describe, but behaviours explain: It’s tempting to select features based on whatever a particular data source offers, and include as many as possible in the learning process. But not all are equally useful, and some can indeed ‘drown out’ the influence of more important signals. So rather than starting from what the data can offer, identify the information seeking behaviours you’d like to explore, and try to find the features that most closely align with them.
- There is no ‘right answer’: As in many investigations of naturalistic phenomena, there is a tendency to look for patterns that make sense or in some way align with our expectations. But those expectations themselves are a subjective, social construct. The fact that we can produce multiple interpretations of the same data underlines the need for a common perspective when comparing patterns in search logs, and to apply recognised models of information seeking behaviour when interpreting the outputs.